Stages of Work: — Data Table Selection — Data Analysis — Visualization
Data Table Selection
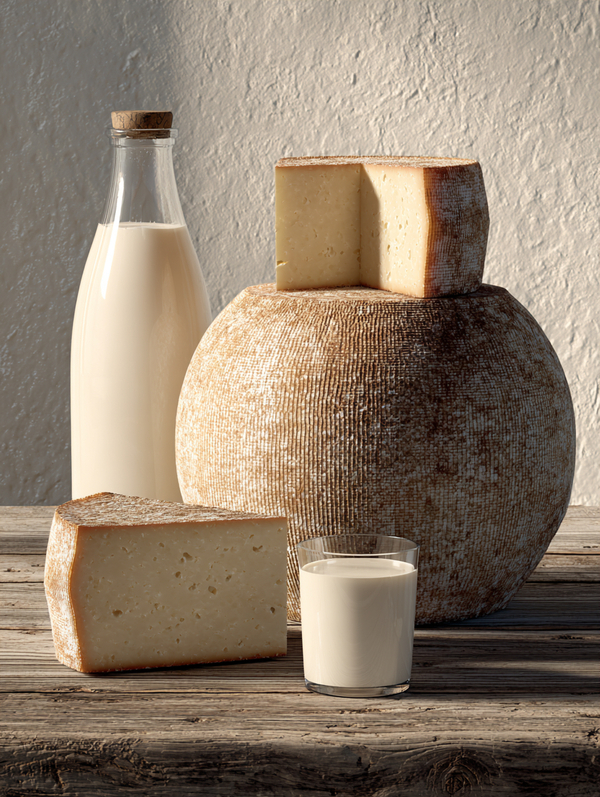
I turned to the Kaggle resource seeking the necessary information and selected a dataset containing details about various cheeses from around the world. I chose this particular dataset because I always have more than seven kinds of cheese in my refrigerator—my family loves it very much—but I know nothing about cheese beyond being able to distinguish holes from Dorblue.
I decided to analyze this data with the aim of identifying the following aspects: categorizing the cheeses by country, by vegetarian status, by color, and by cheese family, and discovering the top 20 cheese producers.
Data Analysis
Downloading CSV format tables in Kaggle. Converting column values to numerical and date formats. Data processing and transformation. Data visualization using various charts.

Visualization
Types of charts created: — Pie Chart — Histogram
Data analysis code and the subsequent transformation of that data into various formats of charts.
It also stores a link to the data.
Pie chart
Vegetarian cheeses account for 1% of the total cheese production.
Variety of cheese families. Blue and Cheddar are the most numerous.
Histogram
The Most Popular: Sartori, La maison Alexis de P., Romaniae Terrae
The United States and France lead in cheese production.
Of course, the yellow and white cheeses lead!
While completing the project, I needed to turn to an additional dataset because the original data set lacked sufficient information to meet all the assignment requirements, especially regarding the quantitative features necessary for building the regression model.
Since milk was found in the refrigerator along with cheese, I thought a logical progression for the analysis would be to find a dataset related to dairy products. Thus, I found and used a dataset containing milk characteristics, including parameters such as pH, temperature, fat content, and other physicochemical properties. This allowed me to complete all stages of the analysis thoroughly: from filtering and creating new features to visualization, statistical calculation, and constructing a linear regression.
Filtering and sorting with a single condition
Temperature of sour milk (pH < 6.5)
Filtering and Sorting